StepOne export settings
Step 1.
Drag file here or choose:
Step 2.
Choose file format:
Step 3.
Choose well:
| Average values: | Tm: ± °C | ∆Guo: ± kJ·mol-1 | ∆Suo: ± kJ·mol-1·K-1 | ∆Huo: ± kJ·mol-1 |
This web server calculates Tm, ∆Guo, ∆Suo and ∆Huo from DSF experiments. The melting temperature (Tm) is calculated using both the Bolztmann method and the derivative method. It is compatible with Roche Lightcycler, ThermoFisher StepOne, ThermoFisher Quantstudio, BioRad and NanoTemper Prometeus systems. All files must be in txt format.
This software is described in the paper TPPU_DSF: A web application to calculate thermodynamic parameters using DSF data, by Pau Martin-Malpartida, Carles Torner, Aurora Martinez and Maria J. Macias. The calculations are based on the protocol described in Extraction of Thermodynamic Parameters of Protein Unfolding Using Parallelized Differential Scanning Fluorimetry, Thaiesha A. Wright, Jamie M. Stewart, Richard C. Page, and Dominik Konkolewicz, J. Phys. Chem.Lett. 2017, 8, 3, 553–558.
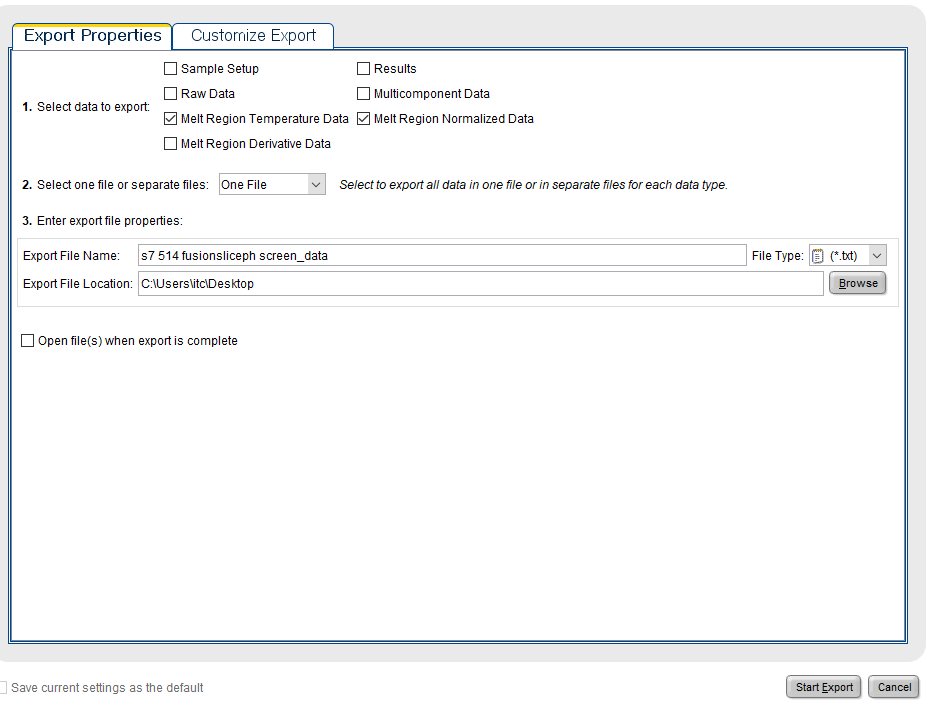
The first step is to Choose your data file. You can download a example data file here. The correct settings for a StepOne export are shown in this image. The format should be autodetected. If it is not, a red banner will be shown and the user should select the format. After that, the user should press the "Analyze data" button. This will process the file and enable the navigation buttons. The user can choose the well to analyze by using the buttons with arrows or the well drop-down menu. The "Add" button will add the well to the analysis list. This is intended to be used for replicates, and the software will calculate the average and the standard deviation for Tm, ∆Guo, ∆Suo and ∆Huo for the selected wells. You can remove the wells clicking on the red cross button.
Finally, the data for the plots, or the plots themselves can be saved by using the "Download csv" and "Download images" buttons. The csv file can be loaded into Microsoft Excel or any other compatible software.
It is important to indicate that the data is not stored in any way on the server, all the processing is performed on the user's computer.
After analyzing the data, a report for the full plate using the will be shown. It can take some seconds to be generated.